
Mastering Database Views in WorqHat
Ready-made WorqHat template
Launch "Mastering Database Views in WorqHat" as a workflow
Duplicate this recipe inside WorqHat to get the outlined triggers, nodes, and delivery logic preconfigured. Update credentials, recipients, and copy, then ship it to production.
- • All workflow nodes referenced in this guide
- • Structured JSON outputs for dashboards and mailers
- • Inline documentation for faster handoffs
Get started checklist
- 1. Duplicate the workflow template.
- 2. Connect your datasource and credentials.
- 3. Customize content and recipients.
Mastering Database Views in WorqHat
Your data can now be visualized the way you think — whether you're debugging, analyzing customer behavior, monitoring issues, or just trying to keep chaos under control.
WorqHat gives you four powerful database views, each built for a different mental model and use case.
Overview
Teams waste hours switching between tools, writing custom queries, or staring at raw JSON just to understand what's happening in their database.
WorqHat Database Views solve this by giving you multiple ways to see the same data:
- Kanban View — Pipeline mode for status tracking
- List View — Log reader mode for monitoring
- Grid View — Spreadsheet mode for analysis
- Large View — Investigate mode for deep dives
Each view is optimized for a specific workflow, so you can work the way your brain thinks.
1. Kanban View — Pipeline Mode
Best for: Operations teams, support ticket management, order fulfillment, issue lifecycle tracking, sales pipeline stages
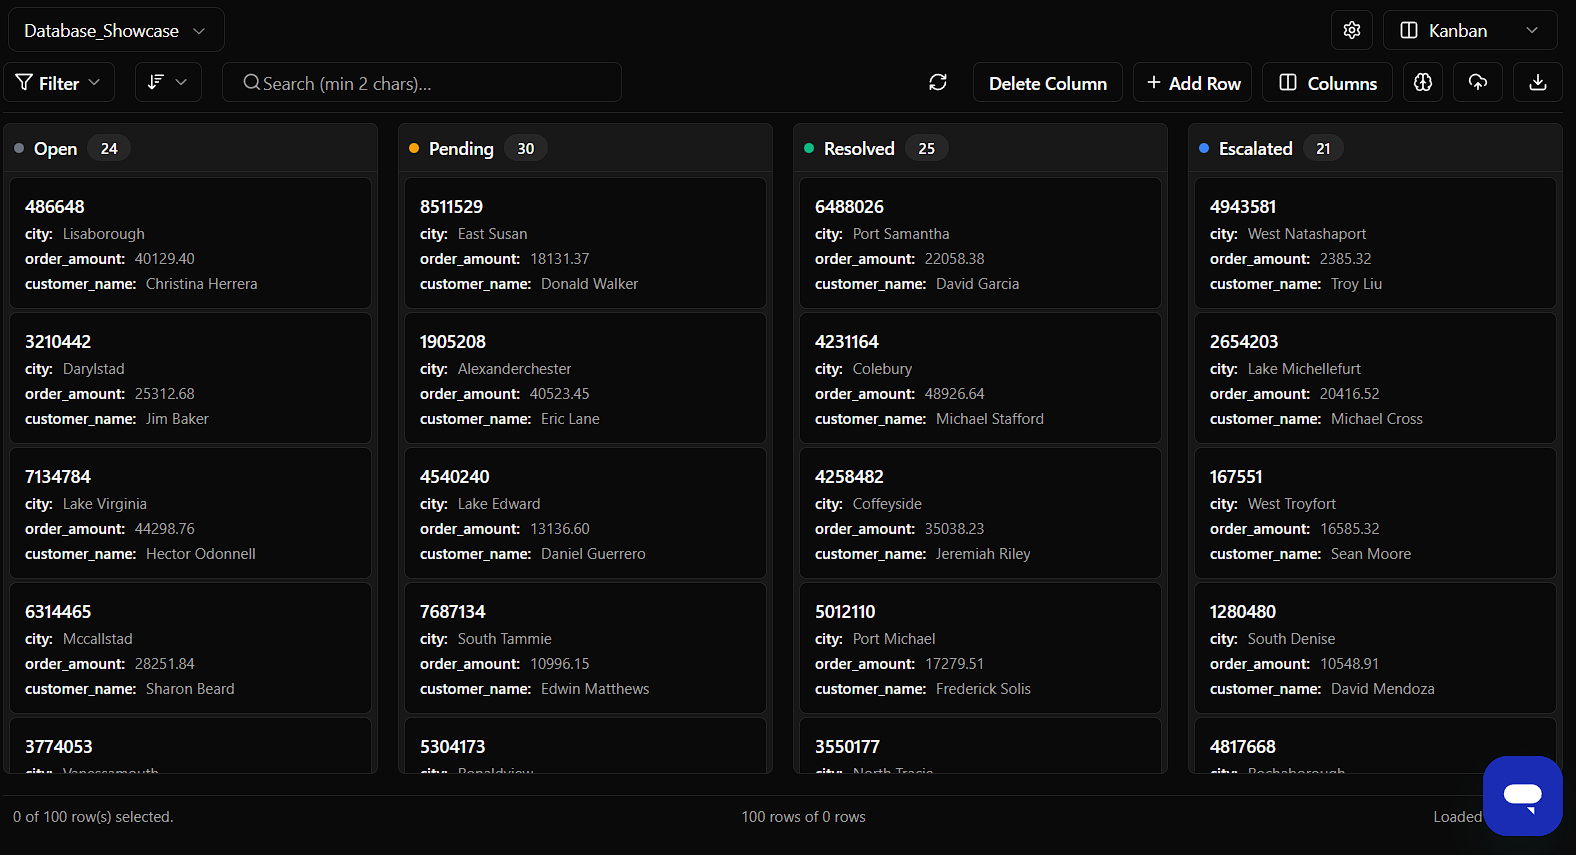
What It Does
Turns any enum column (like status) into a drag-and-drop board. Perfect when you want to see "where everything is" at a glance.
How to Configure
-
Choose a column with type
enum(e.g.,open,pending,resolved,escalated) -
Select up to 3 highlighted fields (e.g.,
city,order_amount,customer_name) -
Rearrange or update items directly by dragging between lanes
Example Setup
Configure in WorqHat:
- Group by:
ticket_status - Title field:
id - Subtitle fields:
city,order_amount,customer_name
Why It's Powerful
- Gives instant clarity of workload distribution
- Lets ops teams update statuses without writing anything
- Reduces back-and-forth between tools
- Great for demos to clients (looks professional)
2. List View — Log Reader Mode
Best for: API analytics, error logs, backend monitoring, internal dashboards
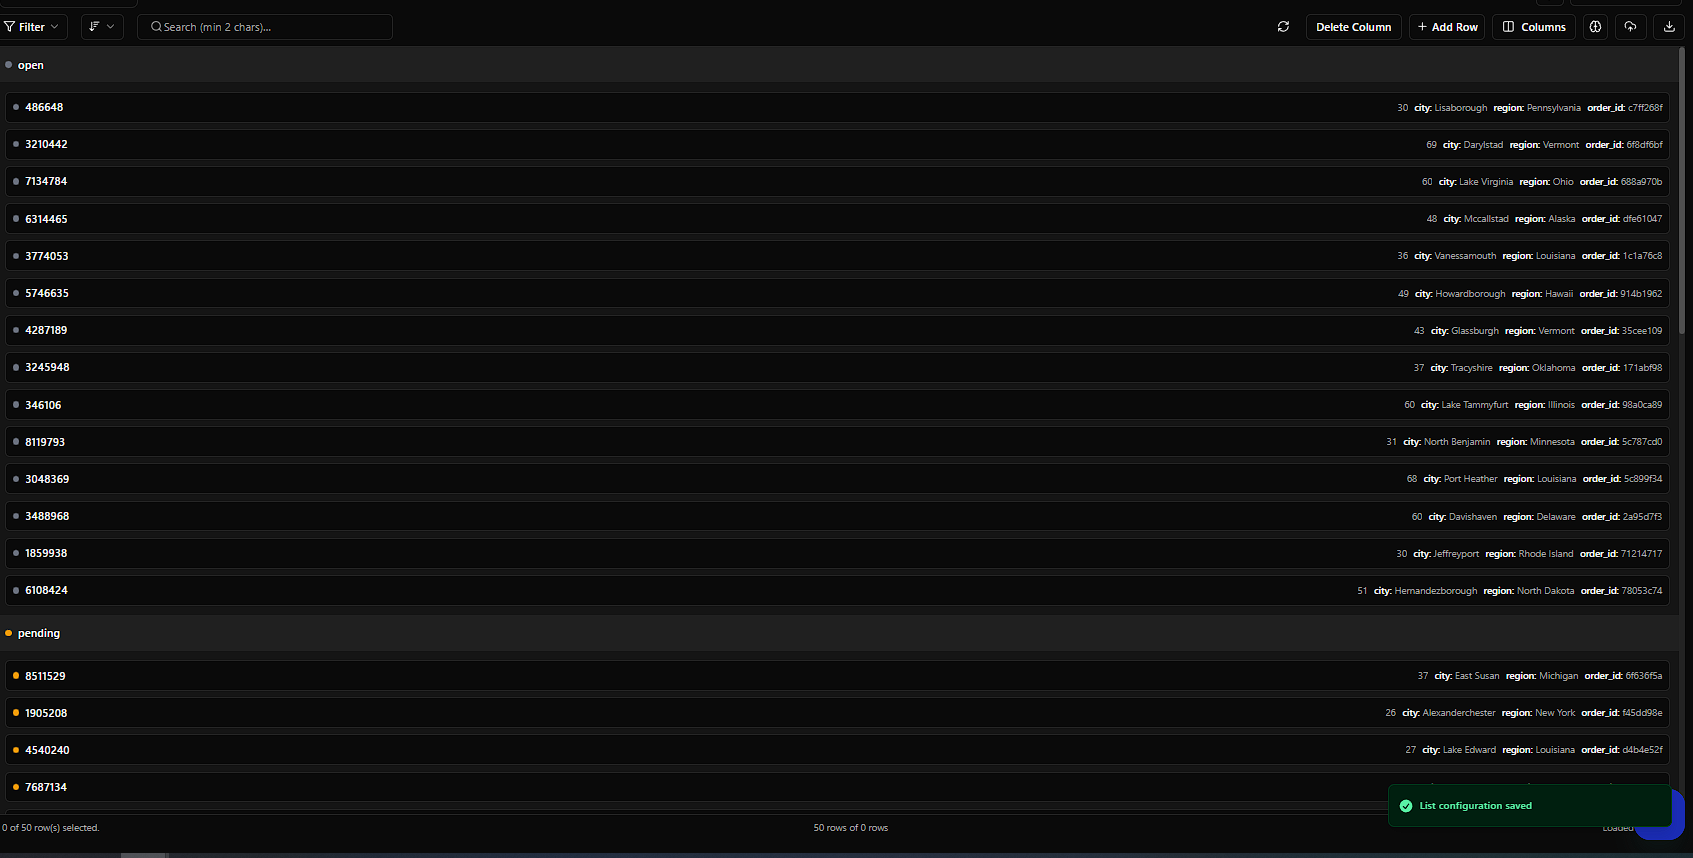
What It Does
Displays the most important fields per row in a clean, scrollable list. Think: "Readable logs without JSON headaches."
How to Configure
-
Pick a title field (usually
id) -
Pick an optional subtitle field (e.g.,
endpoint) -
Select up to 3 extra fields (e.g.,
error_type,created_at,status_code)
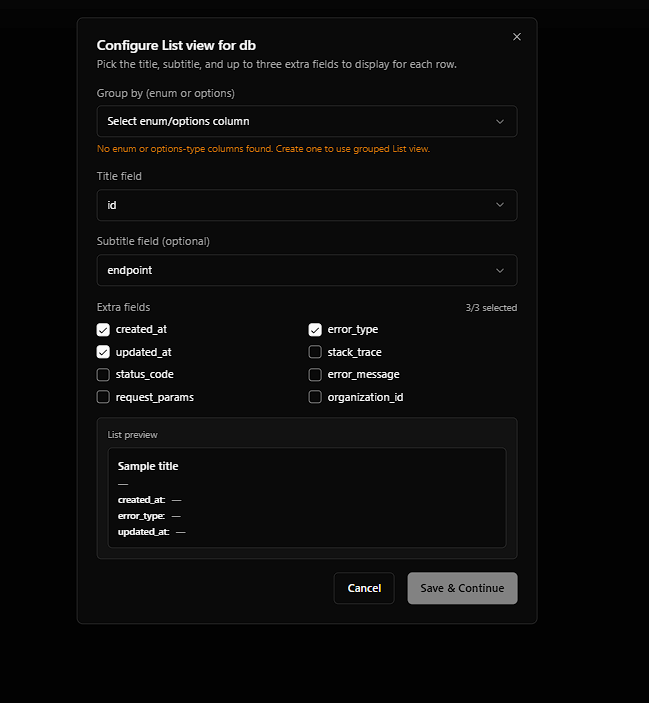
Example Setup
Configure in WorqHat:
- Title field:
id - Subtitle field:
endpoint - Extra fields:
error_type,created_at,status_code
Why It's Powerful
- Perfect for engineering teams
- Helps track high-frequency events
- Replaces Postgres admin panels with something humans can understand
- Quick filtering + semantic search works beautifully here
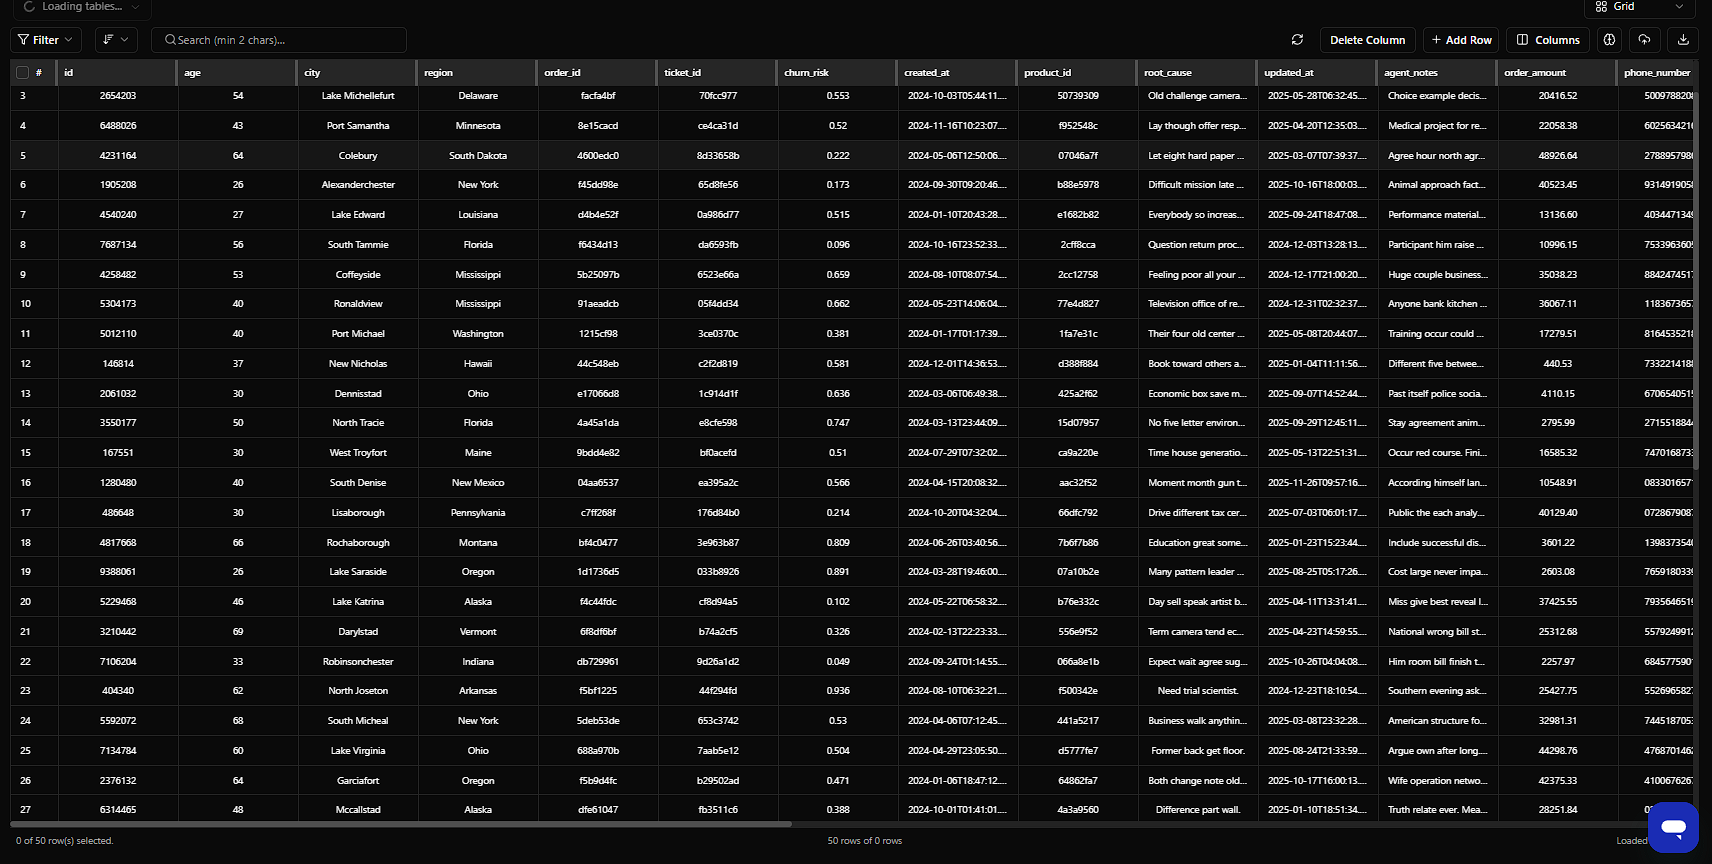
3. Grid View — Spreadsheet Mode
Best for: Analysts, data teams, finance dashboards, bulk editing, "Let me see ALL columns at once" moments
What It Does
A full-table spreadsheet with sorting, filtering, and inline edits. No config needed — it's the default comprehensive table view.
How to Use
Just switch to Grid View — it auto-loads all columns. Supports wide data (20+ columns). Ideal for power users.
Best Columns to Display
idagecityregionorder_idticket_idchurn_riskorder_amountphone_numberroot_causeagent_notes
Why It's Powerful
- Feels like Notion + Airtable + Postgres had a baby
- Great for audits, checks, and reconciliation
- Best view for multi-column filtering + semantic search
- Perfect for large datasets
4. Large View — Investigate Mode
Best for: Deep dives into user profiles, troubleshooting customer issues, postmortems, churn analysis
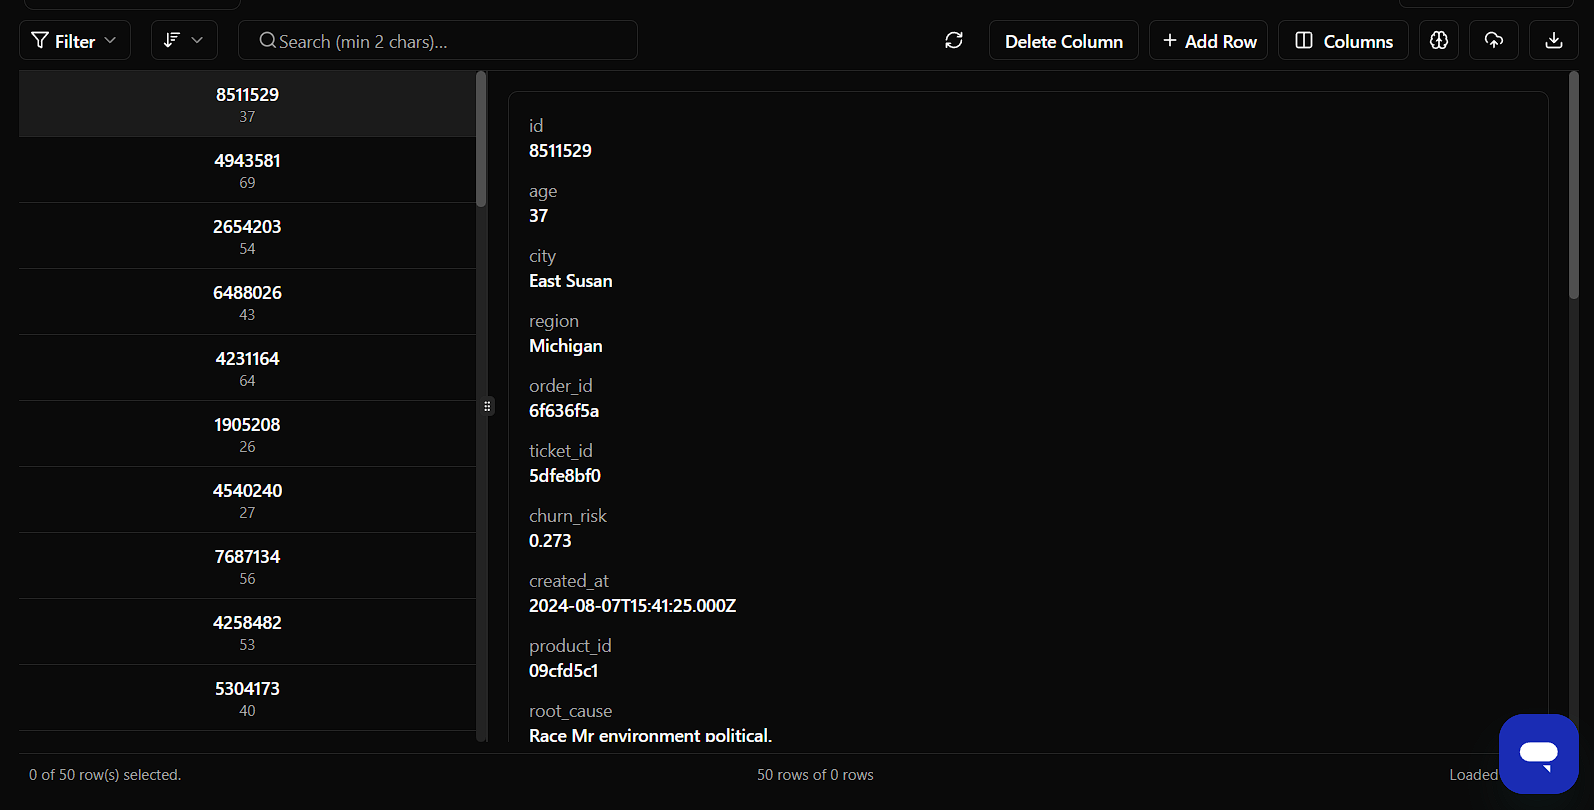
What It Does
Shows every detail of one record in an expanded, readable format. Just click any row → Opens the Large View. No need to pick fields — everything is shown.
What It Shows
All fields in a rich card-style layout:
- Customer info
- Order info
- Churn value
- IDs
- Timestamps
- Root cause text
- Agent notes
When To Use
- Investigating anomalies
- Reviewing customer complaints
- Debugging orders
- QA approval
Why It's Powerful
- Ideal for debugging
- Amazing for support teams who need to see ALL context
- Works great with semantic search + "Find Similar Records"
- Turns raw data into a readable user story
When to Use Which View
| Scenario | Best View | Why |
|---|---|---|
| Ticket pipeline | Kanban | Move stages visually |
| Error logs | List View | Clean, simple, readable |
| Financial data | Grid View | Spreadsheet-like control |
| Customer case deep dive | Large View | Full record visibility |
| Churn analysis | Large View | Every signal in one place |
| Ops workflows | Kanban | Quick drag-and-drop updates |
| Bulk edits | Grid View | Fast, table-friendly |
Outcomes
- No more tool switching — all views in one place
- Faster decision-making — see data the way your brain thinks
- Better team collaboration — ops, engineering, and analytics all use the same source
- Reduced context switching — no more jumping between Postgres, spreadsheets, and custom dashboards
- Professional presentations — Kanban views look great in client demos
Recommended Extensions
- Combine views with semantic search for natural language queries
- Use "Find Similar Records" in Large View for pattern detection
- Set up automated workflows that update status columns (perfect for Kanban)
- Create custom filters that work across all views
- Export any view to CSV for external analysis
Next Steps
Use these views to transform how your team interacts with data:
- Operations teams → Start with Kanban for ticket management
- Engineering teams → Use List View for API monitoring
- Analytics teams → Leverage Grid View for data exploration
- Support teams → Rely on Large View for customer investigations
Build your database schema with these views in mind, and you'll eliminate hours of manual work every week.
👉 Configure your database views in WorqHat and see your data the way you think.